
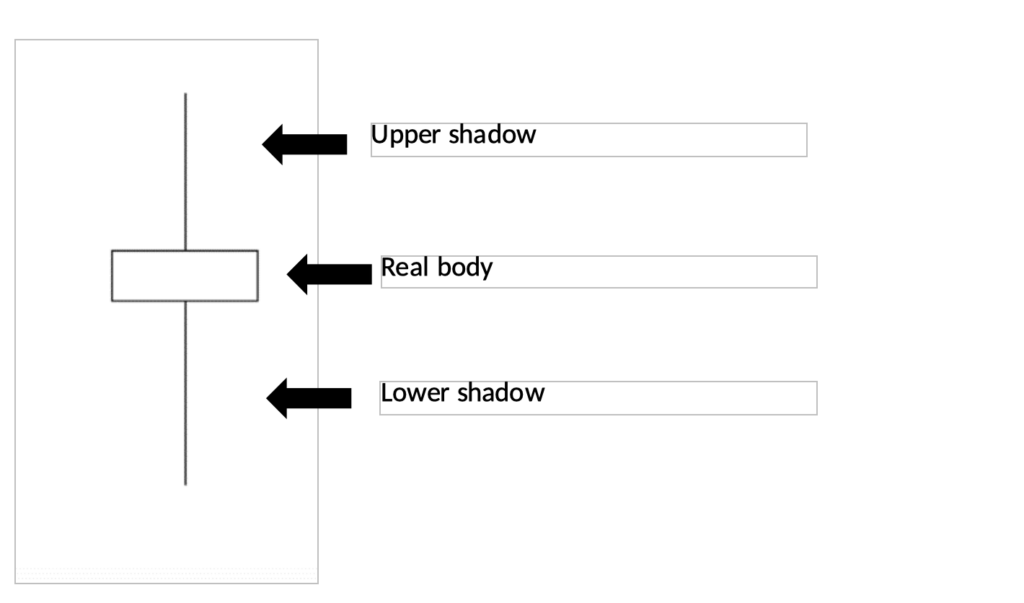
The spinning top is a candlestick pattern in financial technical analysis. A spinning top has a short real body that looks like a rectangle with long lines extending outwards from top and bottom known as upper and lower shadows. A candlestick pattern including a spinning top, according to experts, shows indecision about the future price of a security.
A candlestick pattern is formed when the buyers and sellers push the price up and down at the same time. As a result, the close price of the security is very close to the open price. Spinning tops usually are a signal for price reversal. If the price of the security such as stock has been advancing and then a spinning top candlestick pattern occurs, the next movement is a decline in stock price.
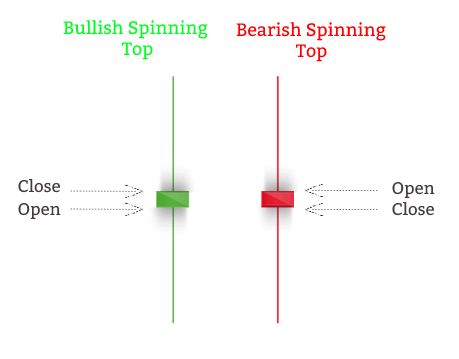
Spinning tops can be formed because of bullish or bearish trade. When the closing price is higher than the opening price of the asset, then it is a bullish spinning top. However, if the closing price is lower than the opening price of the asset, then it is a bearish spinning top.
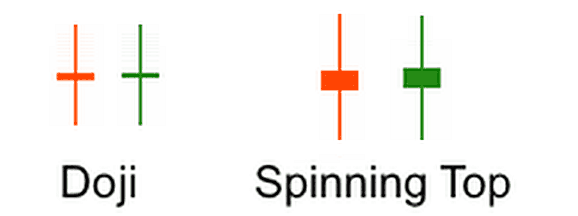
How to differentiate a spinning top from doji?
Both spinning tops and dojis are candlestick patterns that represent indecision in the market price of the asset. The main difference in physical shape of a doji is its small real body and short upper and lower shadows that almost look like a cross. Doji and spinning top patterns are very common and can be seen at spots right before price reversal in a financial chart.
What does Spinning Top indicate?
Spinning tops indicate price indecision and are a signal for price reversal. The long upper and lower shadows of the spinning top indicate that there was no considerable change in the price of the asset.
The bulls send the price higher, and the bears send the prices lower meaning that the buyers and sellers pushed the price to remain close to the open position. This shows that the buyers and sellers have created indecision in the market and in the future, the price is going to move in the opposite direction.
The spinning top at the bottom of the downtrend signals that the price will now move up. Similarly, the spinning top at the top of an uptrend is an indicator of price reversing and going up.
The spinning top candlestick signals a price reversal, but some traders might look for clarification from the next candlestick. If the next candlestick shows an upward or downward trend as indicated by the spinning top candlestick, it serves as a confirmation that a price reversal is taking place.
If the confirmation through the next candlestick does not occur, the trader usually waits for a signal to ensure that reversal is going to take place before their next move.