
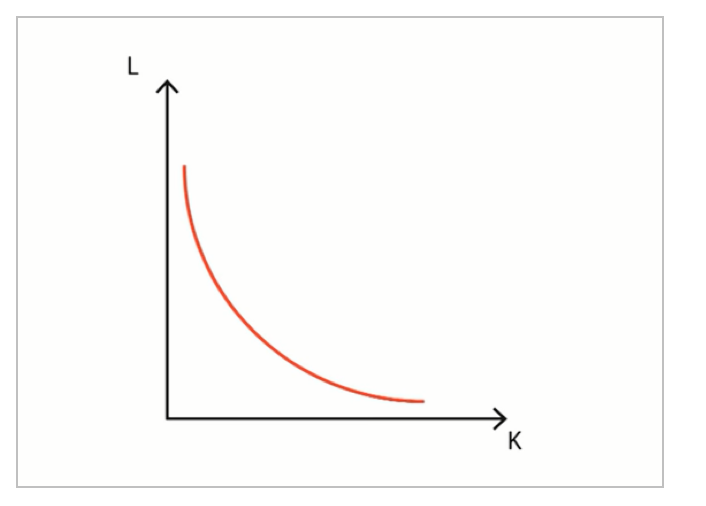
Isoquant curve is a concave shaped drawing on a scatter-plot graph. It is usually used in the field of microeconomics to calculate the level of output that a certain level of input will produce. It is a graphic representation of how two factors can be increased or decreased simultaneously to reach desired results.
Usually, the two factors that are depicted side by side on a graph are the two most important and commonly studied factors of production: capital and labor.
When an isoquant curve is plotted on a graph, it shows all the available combinations of two factors of production. It helps the economists calculate and find the best combination for production that will not only produce optimal quantity of good but also utilizes the labor and capital effectively.
Plotting an isoquant curve helps businesses and microeconomists adjust the inputs and maximize the production of a business company, farm, bakery, etc.
Isoquant is a Latin word that literally means equal quantity. The isoquant curve is also known as equal product curve, iso-product curve and production indifference curve.
Application of Isoquant Curves
How much more capital will be required to replace certain number of labors? This is an important question for economists to answer.
The perfect combination of capital, labor and technological tradeoff are some important factors to keep in mind when preplanning production or evaluating ways to increase production, lower costs, etc. The labor is plotted along X-axis and the capital is plotted along Y-axis.
The isoquant curve is essential for predicting the optimal production capacity because once the optimal production capacity is reached, the addition of factors of production will not be able to increase production significantly. Therefore, to avoid diminishing returns, the isoquant curve is plotted.
Let’s look at the following graphs to understand isoquant curves. The K represents capital and L represents labor. If:
1 unit of labor is 10 workers
1 unit of capital is 1000 dollars
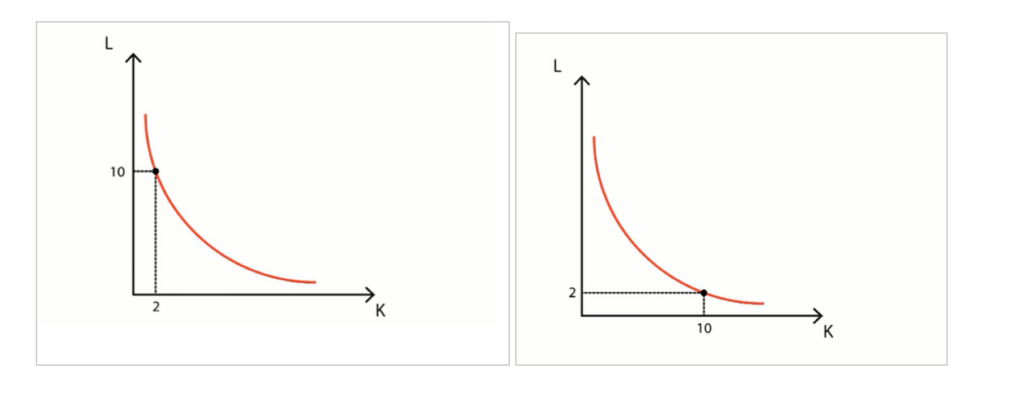
In the first paragraph the company has maximized production with the use of 10 units of labor and just 2 units of capital.
In the second graph, the company has reduced the unit of labor to 2 and the capital employed is at 10. Meaning that the company can produce the same amount of goods by employing 8 more units of capital.
Corporations can increase and decrease the factors of production specially in times when one of them gets expensive or scarce. In the above example, let’s say the company operates in a small town where people keep moving out of that town and go to the city. To keep the production stable while workers keep resigning, employing more capital to replace the workers will be the company’s last resort.
Properties of an Isoquant
Some of the most important quantities of an isoquant are as follows:
- Its shape is a concave line plotted on a graph
- It moves downward from left to right
- The level of output is higher when the isoquant is high and more to the right
- If there are more than one isoquant curves, they cannot intersect one another
- Shape of an isoquant is oval, and it is convex at its origin